
If you have followed our TradingView, you would have realized by now that we like to keep our charts simple and only use a few tools from the technical analysis toolbox. One of our favorite tools is the use of patterns. Trading with patterns can be highly profitable in combination with support/resistance zones, CTL breaks, and supporting fundamentals. Today’s article will be covering three of the most profitable patterns you can implement in your trading.
1, Bullish/Bearish Flag Patterns
Bullish/bearish flags are can be very useful for novice traders as this pattern helps these traders realize that is better to trade with the trend, then against. Flag patterns are continuation patterns, and can be used in conjunction with Fibonacci retracements to get the best entry in a trending market.
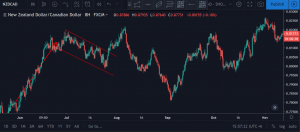
Bearish Flag
This is what traders would call a bearish flag. It is characterized by a current down trend (the pole), followed by a creation of an ascending channel (the flag), after which price continues to fall. I like this pattern for three reasons. You are trading with the trend; they are easy to find, and they have high profitability.
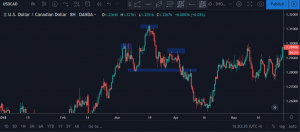
Bullish Flag
Conversely, for a bullish flag we have the opposite occur. A recent uptrend, followed by a descending channel, that is then followed by another leg to the upside.
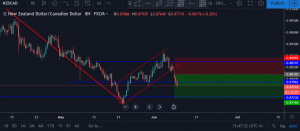
2. The Head and Shoulders Pattern
This is probably the most sought-after pattern for beginner & veteran traders alike and for good reason. When traded properly, the Head and Shoulders Pattern can be a great tool to increase profitability.
Head and Shoulders
The name itself is pretty self-explanatory, but I’ll discuss it anyways. This pattern is characterized by an uptrend, followed by the creation of a left shoulder, a head, a right shoulder and a neckline (where both shoulders attach to the head). When all (5) of these conditions are met, one should wait for a break and retest of this neckline before shorting the pair. There is also an inverted Head and Shoulders Pattern which is the everything I said but done inversely.
3. Double Tops and Double Bottoms
This pattern can be seen quite a lot in the markets and is usually in response to a certain support or resistance zone. A double top pattern will usually imply potential short opportunities, while a double bottom presents a potential long opportunity. Using this pattern in addition with fundamentals can lead to more trading success, if used correctly.
Double Top
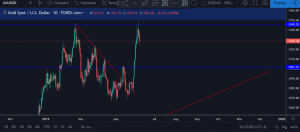
Gold had created a double top after hitting resistance for a second time at 1345,52 area. The pattern was confirmed on a lower time frame, and consequently shorts were taken. The double top is signified by two leveled peaks created at resistance. A bearish reaction from this resistance would indicate a failed attempt of buyers to drive prices higher. Thus, a sell-off may be expected. The same is inversely true for double bottoms.
Patterns are a great confluence to other technical and fundamental factors of analysis. Be sure to practice these patterns on a demo account to ensure that you are using them correctly, before using them on a live account.
To learn more about what we do, check out our website: Home – Forex Lens
We are now hosting daily live trading sessions on our YouTube, be sure to subscribe and have our notifications on: Forex Lens Inc YouTube
Check out our previous posts:
Analysis: Technical and Fundamental Breakdown of the US Dollar by Forex Lens on Forex Lens Analysis
What indicator should I use, if any? by Forex Lens on Forex Lens Analysis
Why You Should Use TradingView for Forex Trading Analysis?
How to get started in trading Forex?
Support / Demand and Resistance / Supply Zones
The US-China Trade War and What it Means for the FX Markets


")

